Bulgaria's Older Goods Vehicles Cover 48.9% of Freight Kilometres. What Does Your Route Ask of the Oldest Van?
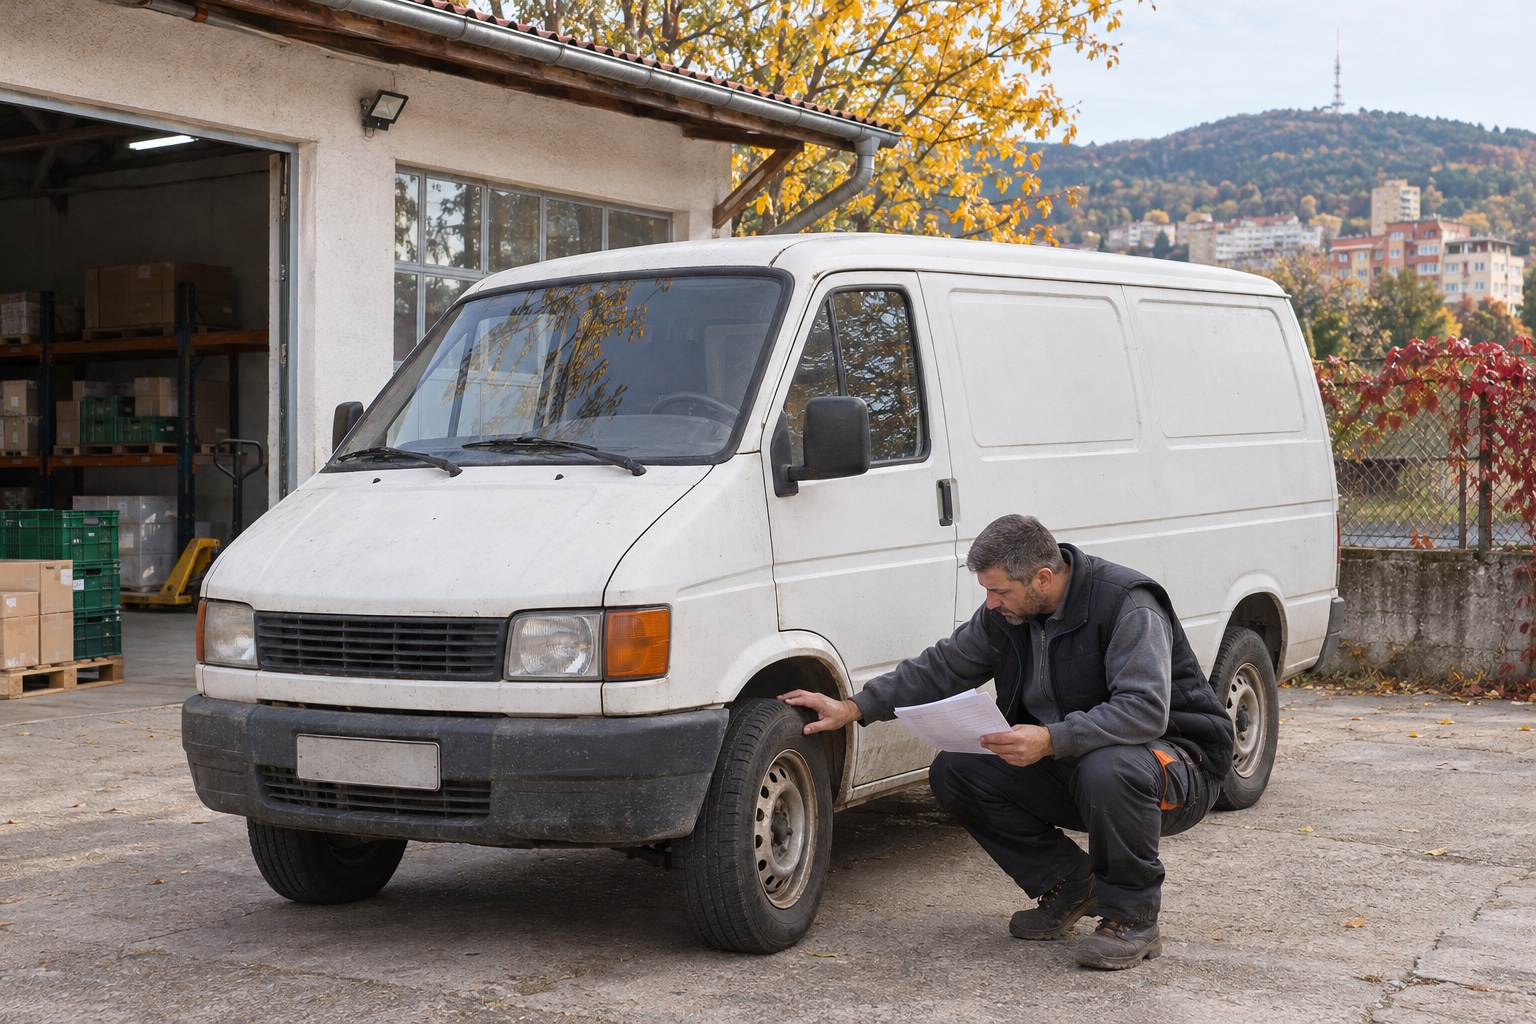
Nearly half of the kilometres travelled by Bulgaria's surveyed freight vehicles in 2025 came from vehicles at least 10 years old. Eurostat puts the share at 48.9%, the highest reported figure among the EU countries in its comparison.
That number should reach the dispatch desk. It says nothing about the condition of your own van. It does make a practical question harder to ignore: do you know what each vehicle costs on the route it actually drives?
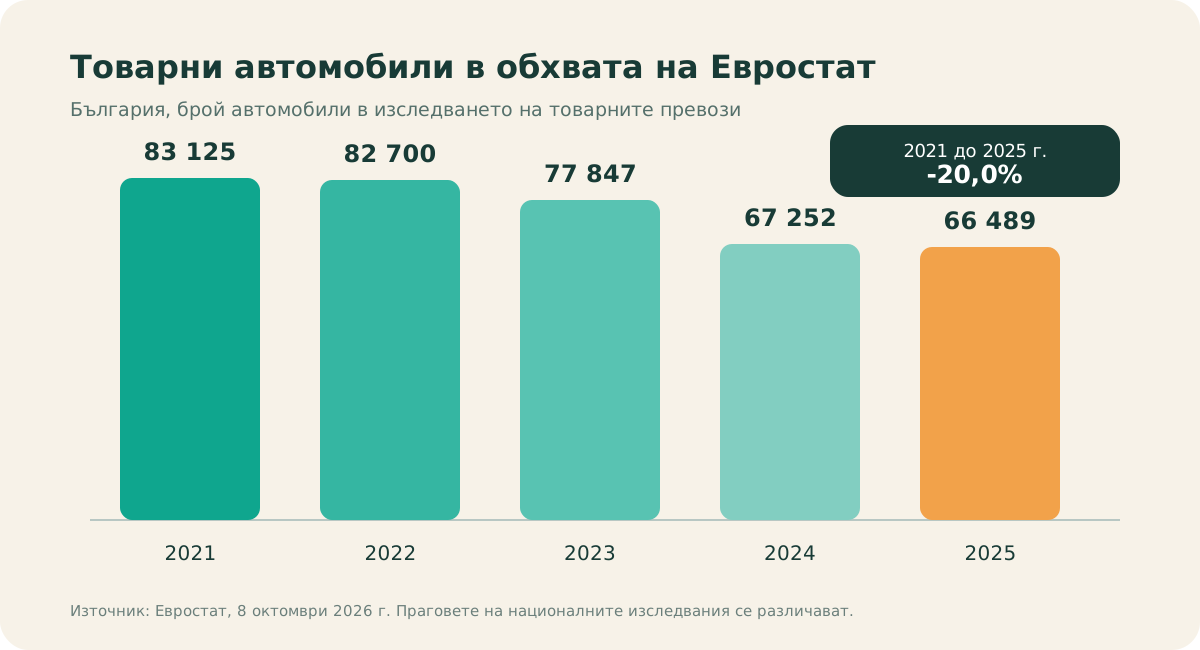
Bulgaria's in-scope goods-vehicle stock fell 20% in four years
Eurostat counted 83,125 Bulgarian goods vehicles in the road-freight reporting scope in 2021. The figure fell to 66,489 in 2025. That is a decline of 20.0%.
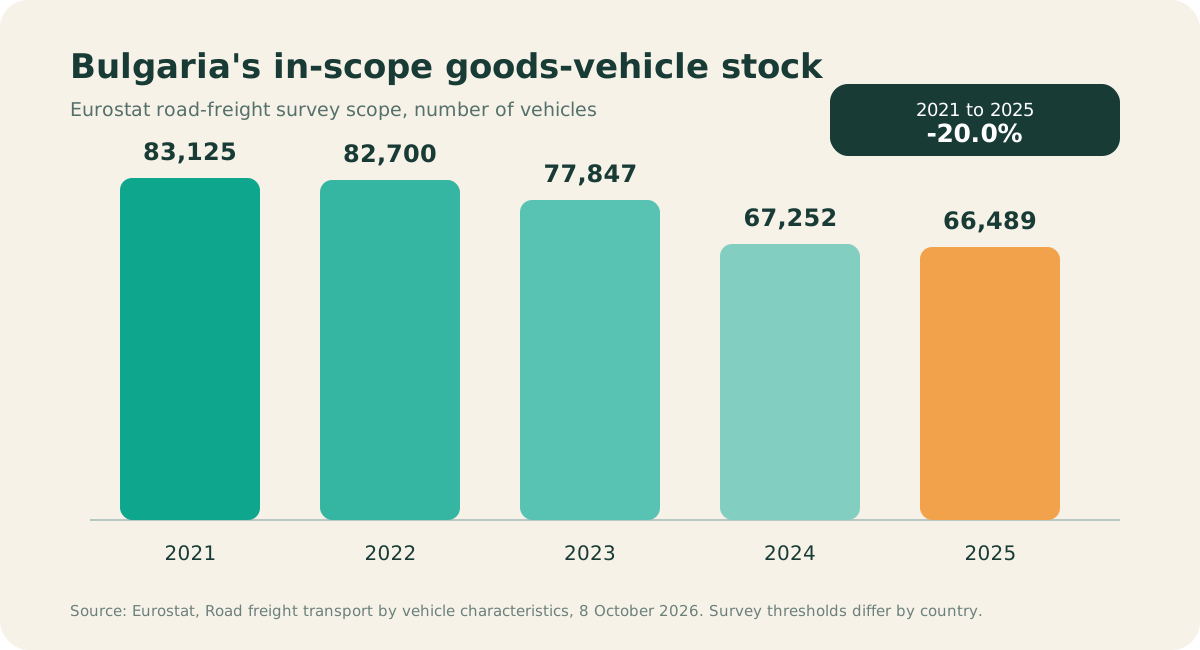
The stock table and the age table describe vehicles inside the European road-freight survey system. National surveys may exclude vehicles with load capacity below 3.5 tonnes or maximum permissible laden weight below 6 tonnes. Many light delivery vans can therefore sit outside these numbers.
Age also means time since first registration. It does not reveal service history, tyre condition, engine efficiency, breakdown risk or suitability for a specific delivery day. Those facts live in the company's records.
Older vehicles carry a larger share of freight work in Bulgaria
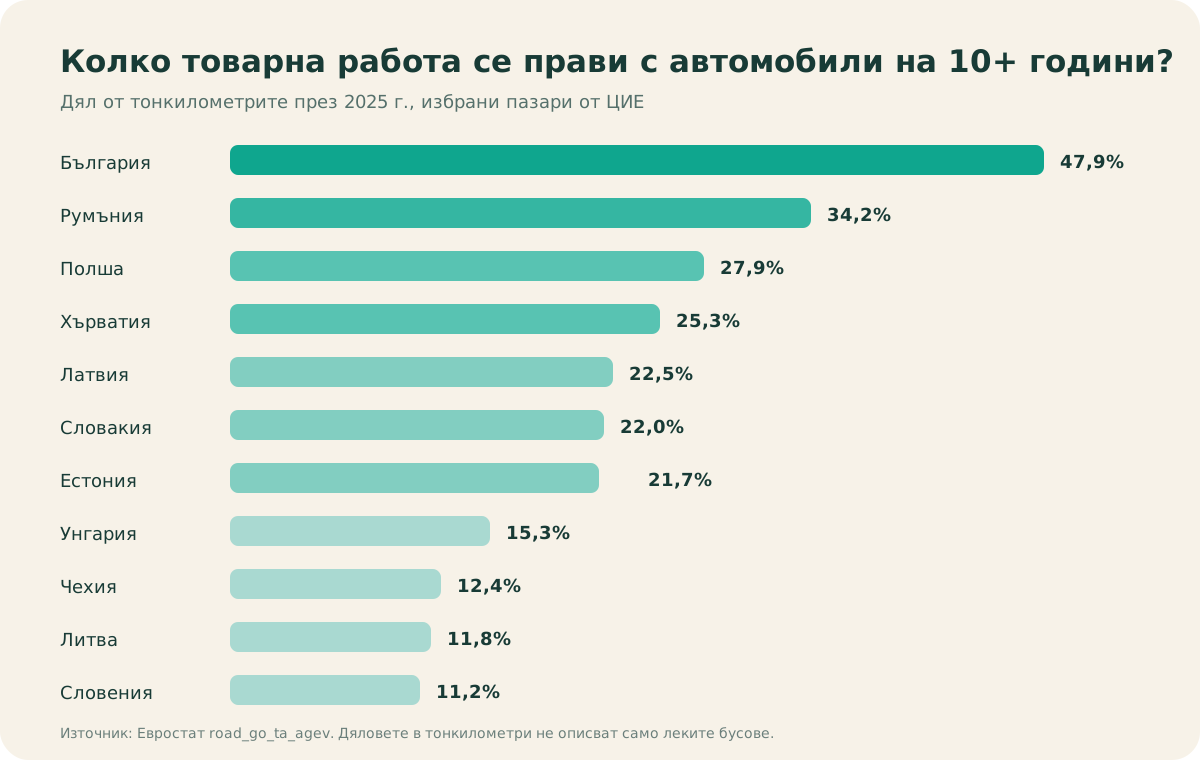
Vehicles aged 10 to 14 years performed 30.1% of Bulgaria's road-freight tonne-kilometres in 2025. Vehicles aged 15 years or more added 17.8%. Together, those two groups accounted for 47.9% of tonne-kilometres.
The regional spread is wide. Romania recorded 34.2%, Poland 27.9%, Croatia 25.3%, and Hungary 15.3%. Czechia was at 12.4%, Lithuania at 11.8%, and Slovenia at 11.2%.
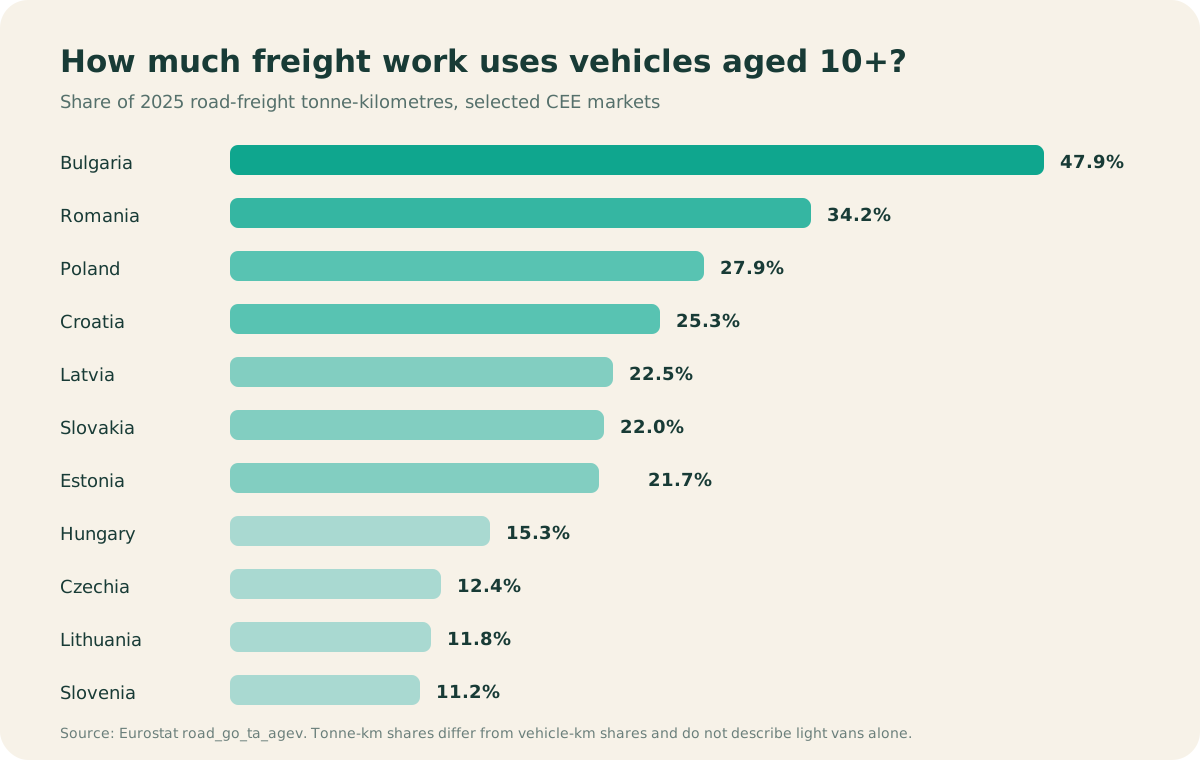
Two measures appear here. The headline 48.9% is the share of vehicle-kilometres, which counts actual distance driven. The regional chart uses tonne-kilometres, which multiplies freight weight by distance. Keeping the measures separate prevents an easy statistical mistake.
One extra kilometre costs this vehicle €0.218 in diesel today
The European Commission bulletin published on 5 November reports Bulgarian automotive diesel including taxes at €1.8927 per litre for the 2 November observation. Consider a vehicle whose measured average is 11.5 l/100 km:
direct diesel per km = 11.5 ÷ 100 × €1.8927 = €0.2176605
Feed the vehicle's measured consumption into this formula. Age cannot supply the value. An older van with disciplined maintenance may perform better than a neglected newer one. The fuel receipt and odometer settle that argument.
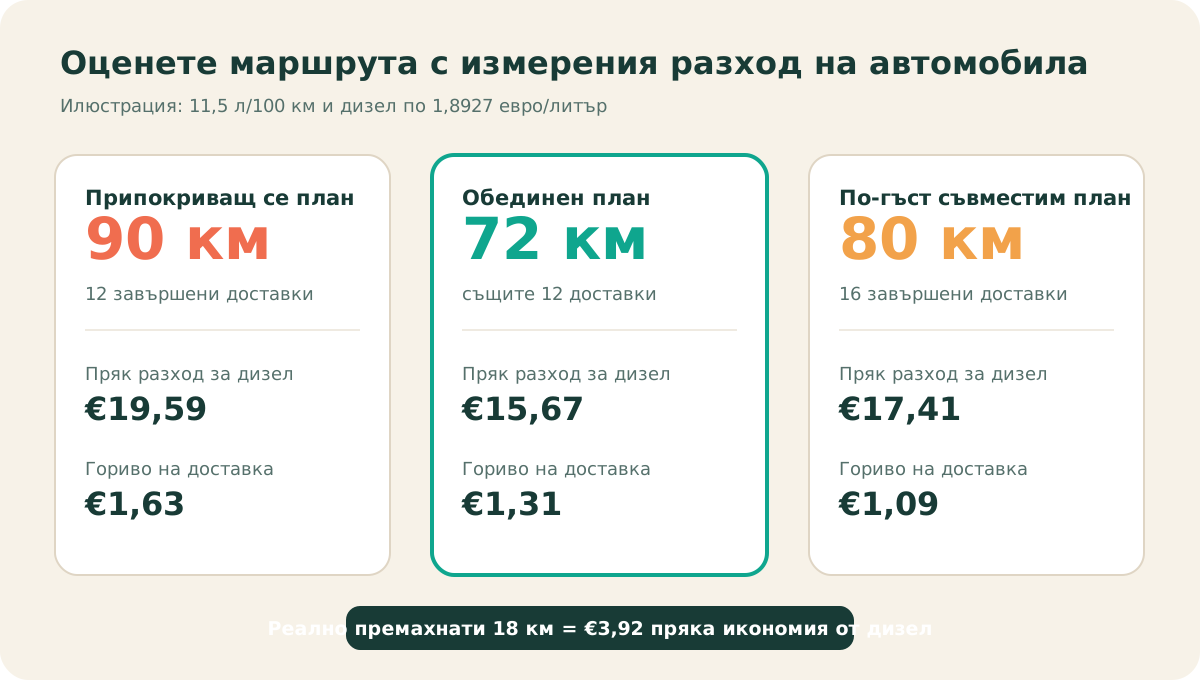
Twelve deliveries can use 90 km or 72 km
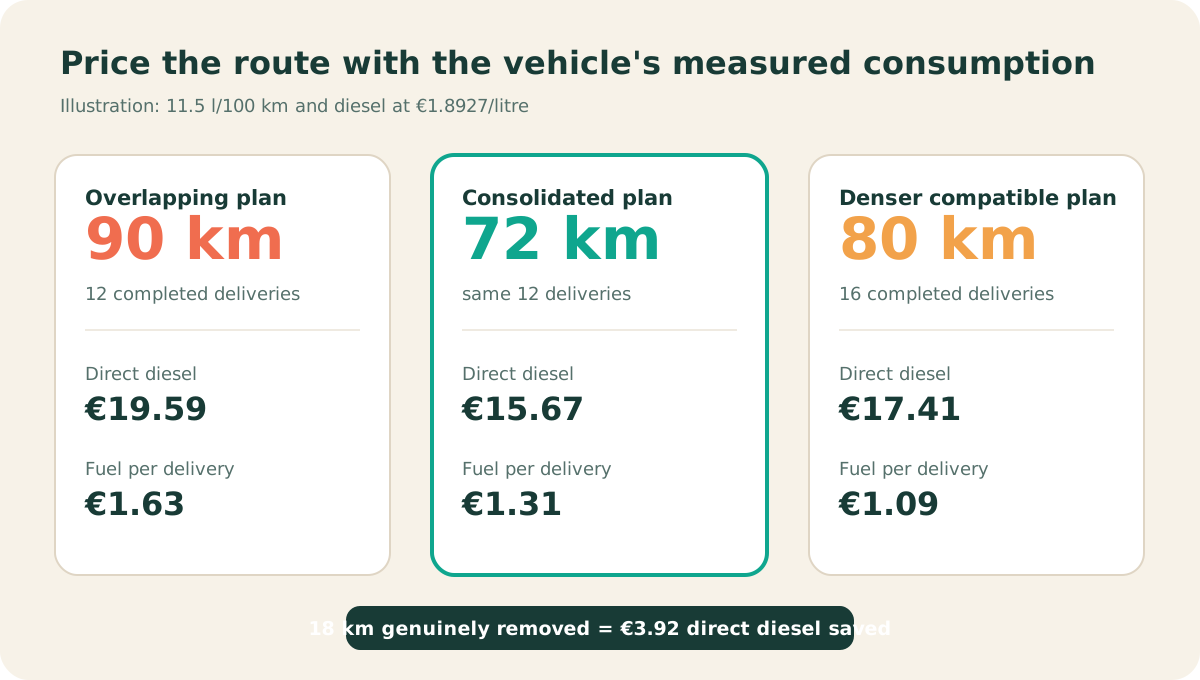
Imagine 12 compatible deliveries assigned as orders arrive. Two routes cross the same corridor and cover 90 km. Planning the complete list by area, capacity and promised time brings the same 12 deliveries into 72 km.
| Measure | Overlapping plan | Consolidated plan | Change |
|---|---|---|---|
| Completed deliveries | 12 | 12 | Same work |
| Total distance | 90 km | 72 km | -18 km, or -20.0% |
| Km per completed delivery | 7.50 | 6.00 | -20.0% |
| Direct diesel | €19.59 | €15.67 | -€3.92 |
The €3.92 is a direct saving when all 12 deliveries are completed and the 18 km disappear from actual driving. Maintenance, tyre, labour and depreciation savings need evidence from the company's own cost records.
Four compatible deliveries change the cost per completed stop
Suppose four more deliveries fit the same area, capacity, access rules and promised times. The consolidated route grows from 72 km to 80 km and completes 16 deliveries. Direct diesel rises from €15.67 to €17.41.
Fuel per completed delivery falls from €1.31 to €1.09, a reduction of 16.7%. The business spends €1.74 more on fuel and completes four more deliveries. Their revenue and service time still decide whether the denser route improves profit.
Build a vehicle-by-vehicle route record
- Measure actual consumption. Use fuel bought and kilometres driven over a representative period. Record city, mixed and long-distance work separately when the pattern matters.
- Record interruptions. Log late starts, breakdowns, workshop time, substitute vehicles and missed deliveries against the vehicle involved.
- Calculate kilometres per completed delivery. Compare similar routes and seasons. A rising figure can expose scattered orders, weak allocation or repeat visits.
- Match work to evidence. Use each vehicle's capacity, access, measured consumption and reliability record when assigning routes. Age remains one field among several.
- Review planned and actual distance. Explain the gap after every route. Traffic, customer absence, loading mistakes and late orders need different remedies.
A small operator does not need a complex fleet system to start. A weekly table with vehicle, route, planned kilometres, actual kilometres, litres, completed deliveries, failed stops and interruption minutes can expose the first expensive pattern.
Where MileCut fits
MileCut lets an owner upload a CSV, XLS or XLSX delivery list, review all stops together, select one to five couriers, adjust the proposed allocation and create Google Maps links. This shared plan can reveal overlapping corridors and keep compatible deliveries on the same route.
MileCut does not read vehicle age, predict breakdowns, enforce service intervals or calculate maintenance cost. The dispatcher remains responsible for vehicle condition, legal checks, capacity, access, loading and safe operation.
Sources and limits: Eurostat, road freight transport by vehicle characteristics, dataset road_go_ta_agev, road-freight survey metadata, European Commission Weekly Oil Bulletin, and the MileCut guide. Sources checked 6 November 2026. Eurostat data may exclude light vans. The route, consumption and delivery figures are illustrative. Use invoices, odometer readings and completed-route records for business decisions.
Give every delivery and every vehicle one shared plan.
Group compatible stops, compare route distance and review the proposed allocation before dispatch.